


Optimize Project Allocations with a Quick Look on Your Dashboard
The Project Manager’s job is not an easy one. Making balanced allocations, tracking lots of tasks, keeping an eye on the financials, and having a good overview on the project – not an easy job at all. So, to juggle all these “balls” in your hands without dropping any, you’ll need all the help you can get. Obviously, a resource planning tool is a Project Manager’s best friend. But would just any resource planning tool do the job?
What if you have more projects to run at the same time? Or what if you’re a business owner? Can you get the best possible results by only using a tool to allocate resources? Or do you want to go next level and check projects related key metrics to increase your efficiency and optimize your activity? If so, a project management dashboard is the key here!
Let’s take a quick peek at elapseit dashboard and see how it can help you take your projects to the next level of efficiency!
To easily track your resources, elapseit dashboard offers two perspectives: logged hours (to compare allocated vs logged hours statistics) and burnt hours (to compare allocated vs burned hours statistics).
Let’s check more in detail what you get:
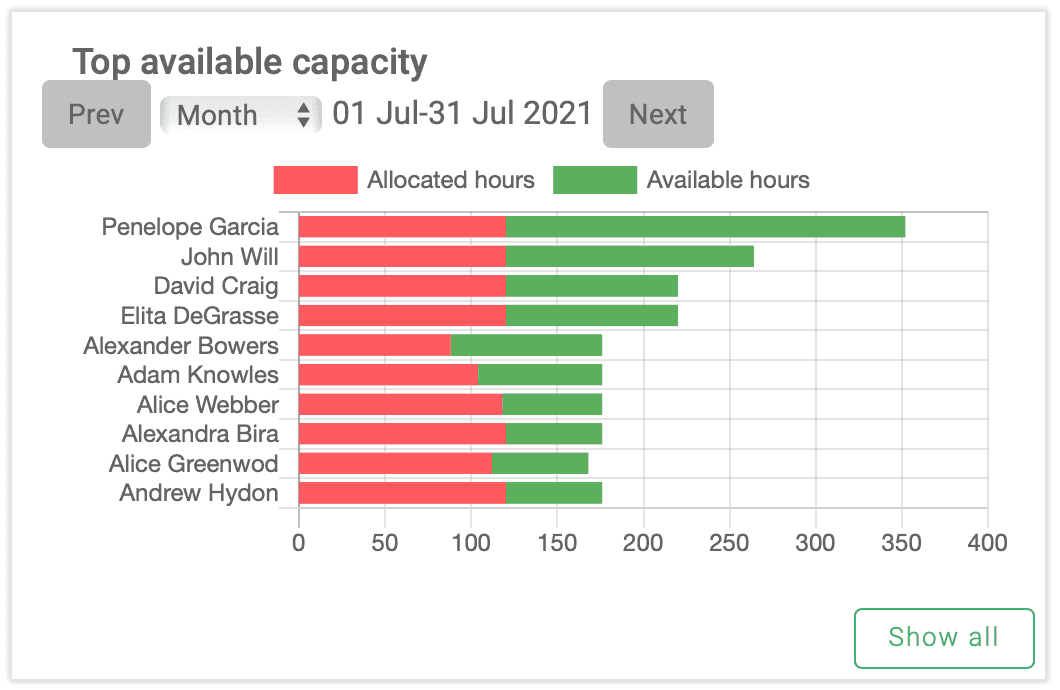
- Top available capacity – a quick overview of the most available people (or the most under allocated people 😊) on current day / week / month. You can see for each person the number of allocated and available hours. The number of available hours is calculated according to the number of hours agreed in the employment contract. Time off is also considered to offer you the exact number of available hours.
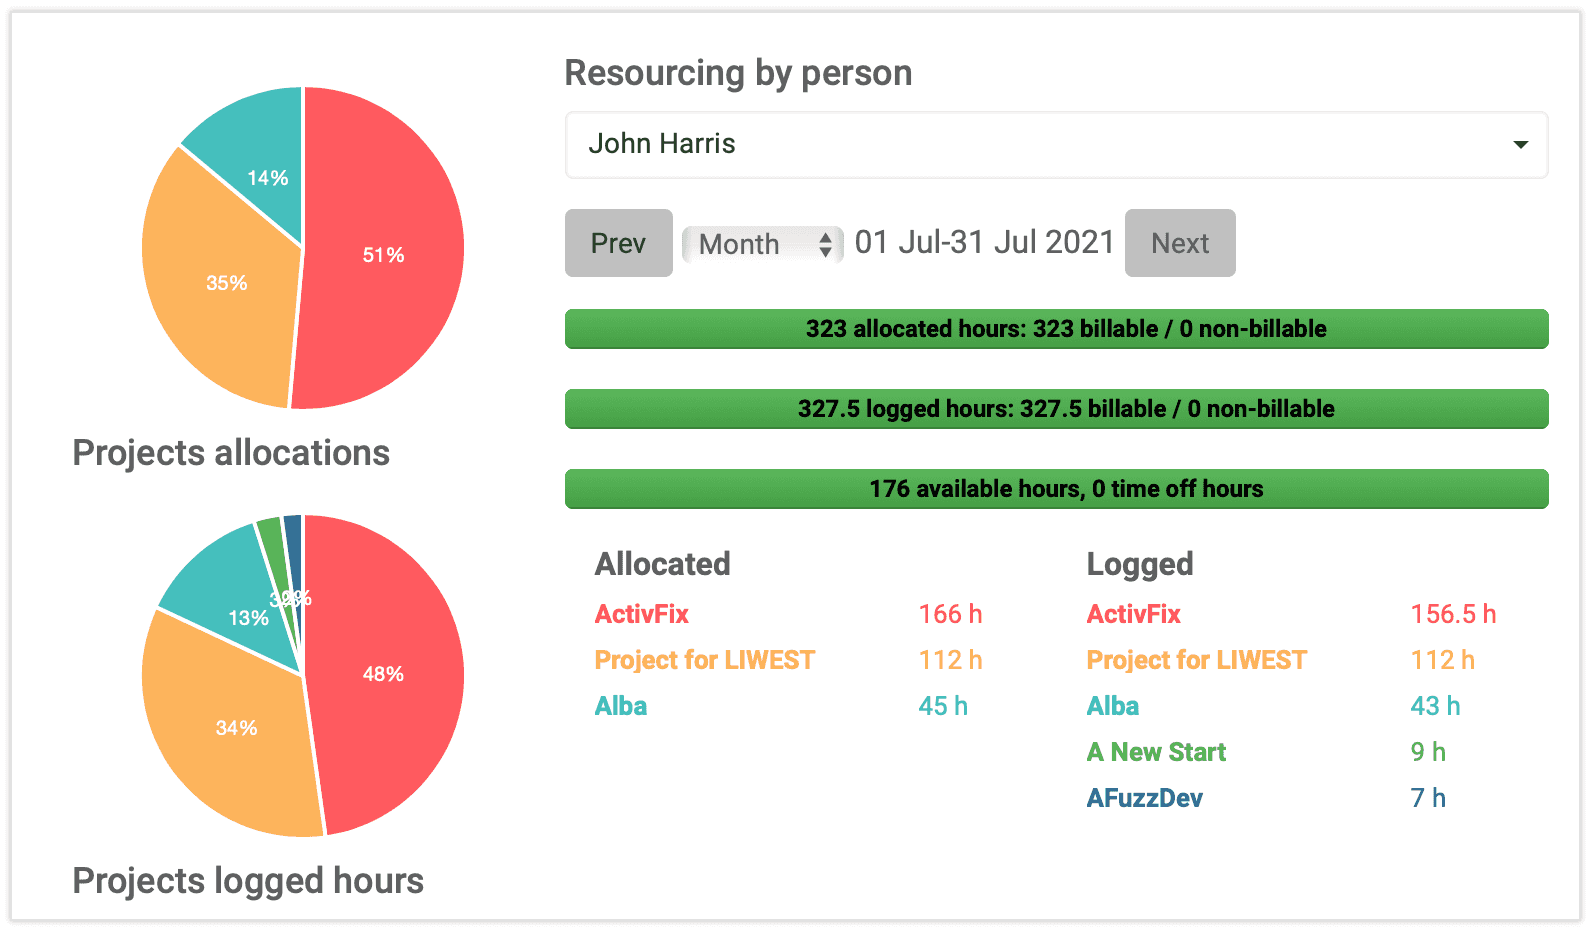
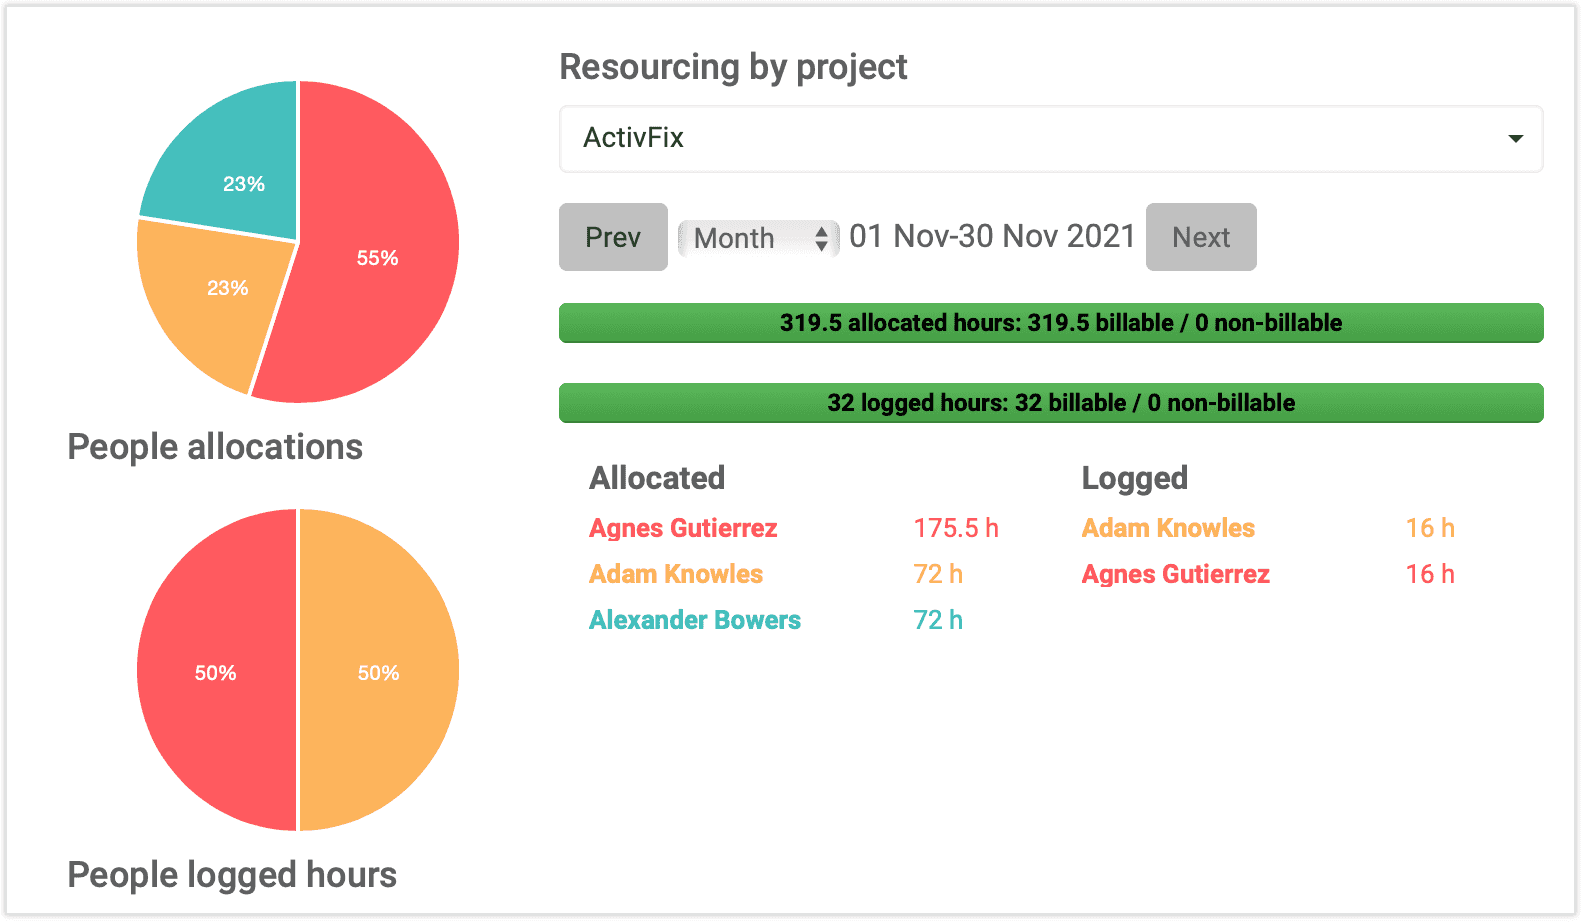
- Resourcing by person - in depth information about each resource allocation for the selected period. Choose either logged hours or burned hours view to see the total number of allocated, logged, or burned hours and how many of them are billable. Both views will show you how these hours are split on the projects the selected employee was allocated on. Since the total number of available hours and time off hours are displayed, you’ll be able to quickly spot if that person was over or under-allocated during the selected period.
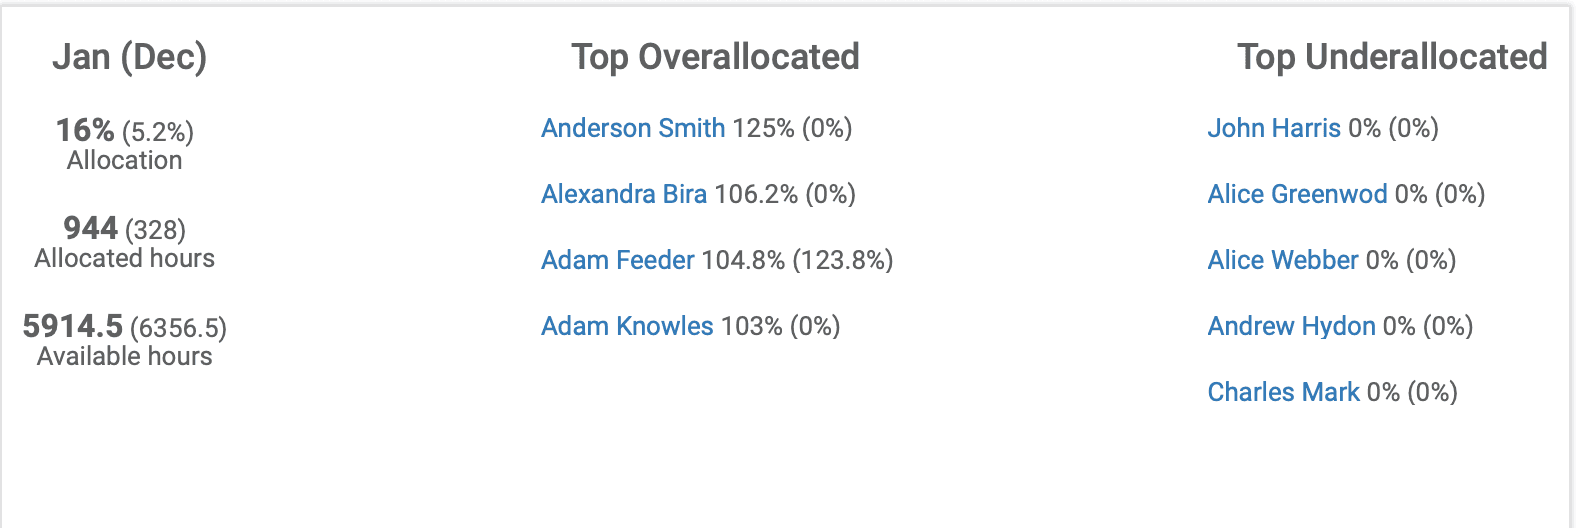
- A top over and under allocated people statistic - in just one view you can see the top five over and under allocated people during current and previous month. The overall allocations % and display of total number of available and allocated hours will point on how efficient the allocations were done on projects. Ideally, you shouldn’t see any member in your team in this view. But, if any name pops up here, there’s a disbalance in your allocations and you need to check where the issue is and restore the balance.
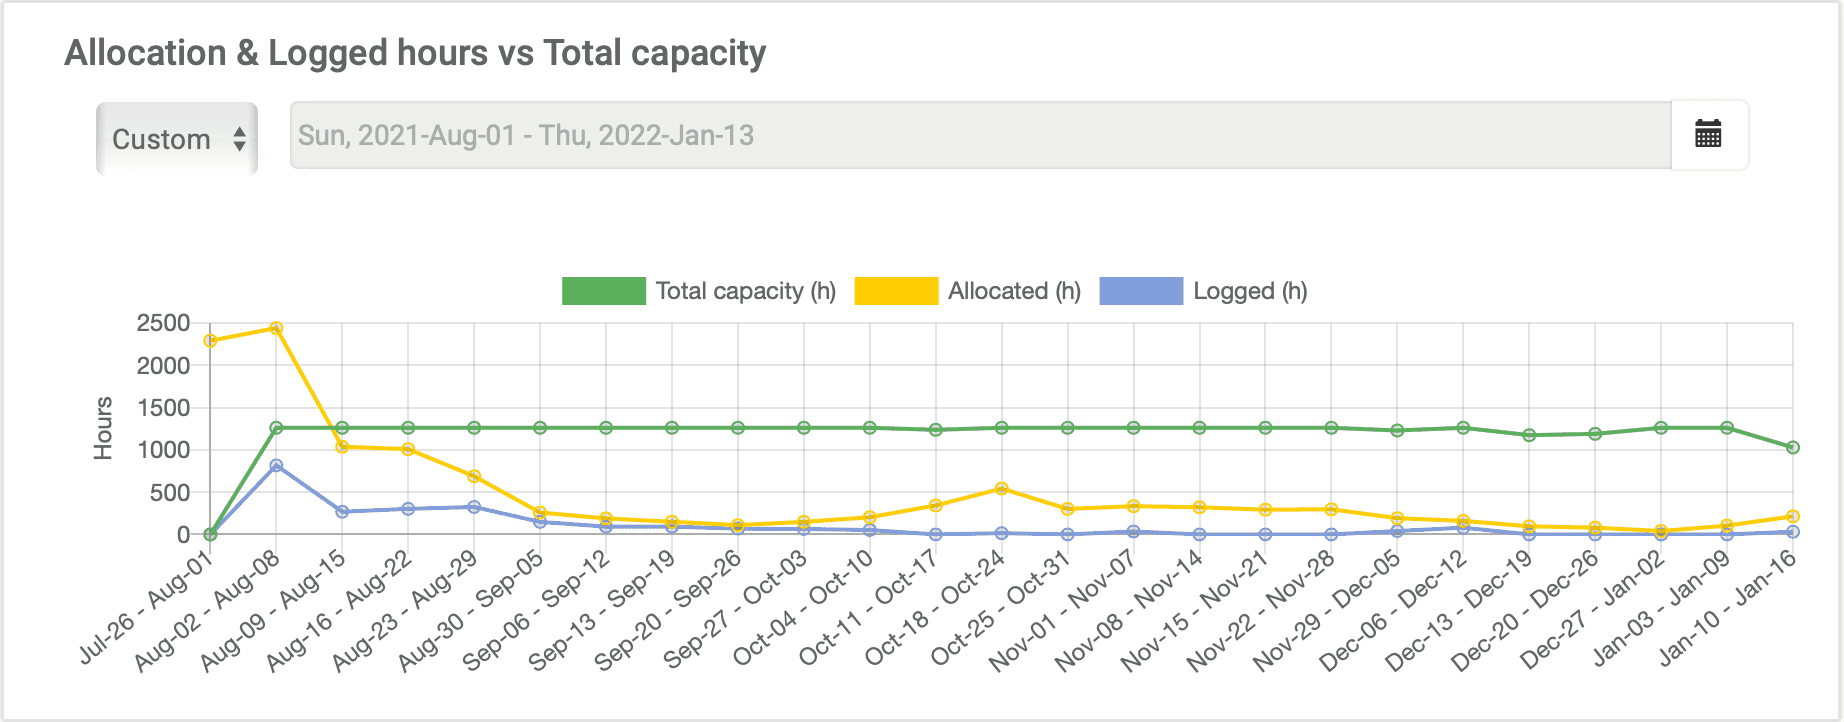
- Allocations & burned hours vs total capacity graph - a straight to the point view of overall resources efficiency for a selected period. Take a guess, what’s the efficiency level in the view below? 😊
To conclude, with elapseit dashboard you’ll get high level metrics for projects allocations to help you easily track your resources and make the best possible decisions to your team efficiency when needed.